New Weather Station - Davis Vantage Vue - Part 2 of 2: Linux installation
Tuesday, November 5. 2019
This is a part two out of two on my Davis Vantage Vue weather station installation story. Previous part was about hardware installation.
Datalogger expansion
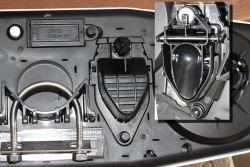
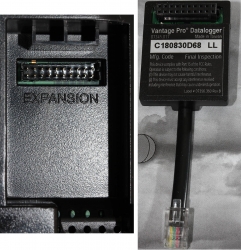
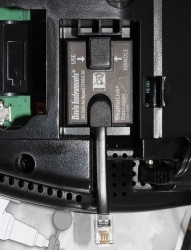
The indoors console has a slot for expansion devices. I went for the RS-232 WeatherLink datalogger expansion:
RS232 Cabling
The datalogger has a very short cable and a RJ-11 connector on the other end. The obvious good thing is the common availability of telephone extension cords to get past the 5 cm cable lenght of the datalogger. A regular landline telephone typically has such RJ-11 connectors in it and what I did was to get an inexpensive extension cord with suitable lenght.
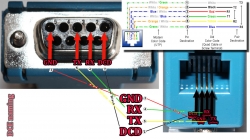
For computer connectivity, with datalogger box has a blue RJ-11 to RS232 converter. The four connected pins of the converter are as follows:
RS232 and Linux
Most computers today don't have a RS232-port in them. To overcome this, years ago I bought a quad-RS232-port USB-thingie:
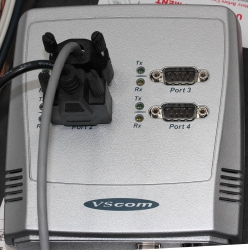
If you look closely, Port 1 of the unit has a DIY RS232-connector attached into it. That's my Vantage Vue cable connected to the indoors console. Also, note the lack of the blue RJ-11 to RS232 converter unit. I reverse engineered the pins and soldered my cable directly to a D-9 connector to get the same result.
Now the hardware parts is done. All the connectors are connected and attached to a PC.
Software
Half of the work is done. Next some software is needed to access the data in the data logger.
For Windows and macOS
Those not running Linux, there is WeatherLink software freely available at https://www.davisinstruments.com/product/weatherlink-computer-software/. It goes without saying, the software is useless without appropriate hardware it gets the inputs from. I never even installed the software, as using a non-Linux was never an option for me. So, I have no idea if the software is good or not.
For Linux
As you might expect, when going to Linux, there are no commercial software options available. However, number of open-source ones are. My personal choice is WeeWX, its available at http://www.weewx.com/ and source code at https://github.com/weewx/weewx.
Install WeeWX:
- Download software:
git clone https://github.com/weewx/weewx.git - In git-directory, create RPM-package:
make -f makefile rpm-package SIGN=0 - As root, install the newly created RPM-package:
rpm --install -h dist/weewx-3.9.2-1.rhel.noarch.rpm - That's it!
Configure WeeWX:
- (dependency) Python 2 is a requirement. Given Python version 2 deprecation (see https://pythonclock.org/ for details), at the time of writing, there is less than two months left of Python 2 lifetime, this project really should get an upgrade to 3. No such joy yet.
- (dependency) pyserial-package:
pip install pyserial - Run autoconfig:
wee_config --install --dist-config /etc/weewx/weewx.conf.dist --output /etc/weewx/weewx.conf- In the array of questions, when being asked to choose a driver, go for
Vantage (weewx.drivers.vantage)
- In the array of questions, when being asked to choose a driver, go for
- Inspect the resulting
/etc/weewx/weewx.confand edit if necessary:- Section
[Station]week_start = 0
- Section [StdReport]
HTML_ROOT = /var/www/html/weewx
- (optional for Weather Underground users), Section
[StdRESTful]- Subsection
[[Wunderground]] - Enter station name and password
enable = true
- Subsection
- Section
- Configuring done!
Now you're ready (as root) to start the thing with a systemctl start weewx.
On a working system, you should get LOOP-records out of weewxd instantly. After a little while of gathering data, you should start having set of HTML/CSS/PNG-files in /var/www/html/weewx. It's a good idea to set up a web server to publish those files for your own enjoyment. This is something you don't have to do, but I strongly advice to enable HTTP-endpoint to your results. I will immensly help determining if your system works or not.
One reason I love having a weather station around is to publish my data to The Net. I've been tagging along with Weather Underground for years. There has been good years and really bad years, when Wunderground's servers have been misbehaving a lot. Now that IBM owns the thing, there has been some improvements. The most important thing is there is somebody actually maintaining the system and making it run. Obviously, there has been some improvements in the service too.
Aggregation problem
When I got my system stable and running, I realized my wind data is flatline. In nature it is almost impossible for not to be windy for multiple days. I visually inspected the wind speed and direction gauges, they were working unobstructed. However, my console did not indicate any wind at all.
After multiple days of running, I was about to give up and RMA the thing back to Davis for replacement, the console started working! That was totally unexpected. Why: 1) the system did not work, 2) the system started working without any actions from me. That was the case for me. As the problem has not occurred since, it must have been some kind of newness.
What next
Now that everything is up, running and stays that way. There's always something to improve. What I'm planning is to do is pump the LOOP-records to Google BigQuery.
As a side note: when new information is available, it will be emitted by weewxd as LOOP: <the data here> into your system logs. However, that data isn't used. After a period of time, your Vantage Vue will aggregate all those records into a time-slot record. That will be used as your measurement. Since those LOOP-records are simply discarded I thought it might be a good idea to base some analytics on those. I happen to know Google BigQuery well from past projects, all that I need is to write a suitable subsystem into weewx to pump the data into a correct place. Then it would be possible to do some analytics of my own on those records.
New Weather Station - Davis Vantage Vue - Part 1 of 2: Hardware installation
Monday, November 4. 2019
Last July, there was a severe hailstorm in my area. At the time, I wrote a blog post about it, because the storm broke my weather station. Since fighting with nature is futile, I'm blaming myself for relying on La Crosse -approach of using zipties to attach the components to a steel pole. Given my latitude, 61° north, during summer it can be +30° C and during winter -30° C. The huge variation of temperature combined with all the sunlight directed to nylon straps will eventually make them weak. So, here is my mental note: Next time use steel straps!
I did that when I got my new weather station. This post is about the hardware and getting it fastened securely. The next part is about getting the device talking to my Linux and pumping the results to The Net.
Davis Vantage Vue
After careful consideration, I went for a Vantage Vue from Davis Instruments.
Since this is a serious piece of hardware, in their ranking this 500,- € piece is a "beginner" model. In Davis catalog, there are "real" models for enthusiasts costing thousands of $/€. I love my hardware, but not that much. ![]()
What's in the box
For any weather station from cheapest 10,- € junk to Davis, there's always an indoor unit and outdoor unit.
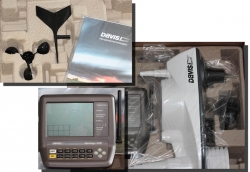
In the box, there is paper manuals, altough I went for the PDF from their site. Indoors unit is ready-to-go, but outdoors unit has number of sensors needing attaching. Even the necessary tools are included for those parts, which require them. Most parts just click into place.
The Vantage Vue console is really nice. There is plenty of buttons for button-lovers and a serious antenna for free placement of the indoor unit. The announced range between units is 300 meters. I didn't test the range, but the signal level I'm getting in my setup is never below 98%. Again, serious piece of hardware.
Installing sensors
Some assembly is required for the outdoors sensor unit. I begun my assembly by attaching the replaceable lithium-ion battery.
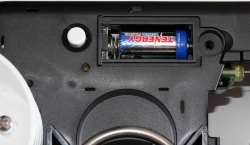
The Li-Ion battery is charged from a solar cell of the sensor unit. I have reports from Finland, that given our lack of sunshine during winter, the sensor unit does survive our long and dark winter ok. I have no idea how long the battery wil last, but I'm preparing to replace that after couple of years.
Next one, anemometer wind vane:
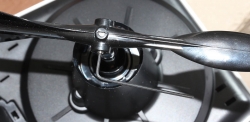
Gauge for wind direction requires fastening a hex screw, but the tool in included in the box. Wind speed gauge just snaps into place. Unlike wind vane, which is hanging from the bottom of the unit, speed gauge is at the top of the unit, so gravity will take care of most of the fastening.
On the bottom of the sensor unit, there is a slot for a bucket seesaw. When the bucket has enough weight in it, in form of rainwater, the seesaw will tilt and empty the bucket. Rain is measured on how many seesaw tilts will occur. Again, this is a real scientific measurement unit, there is an adjustment screw for rain gauge allowing you to calibrate the unit. On top of the rain gauge, there is a scoop. On the bottom of the scoop, you'll need to attach a plug keeping all the unwanted stuff out of the bucket:
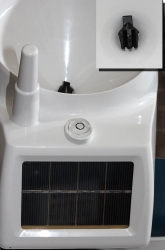
Also note three details in the pic: the solar cell, transmitter antenna and a level bubble helping you during installation of the sensor unit.
Outdoors sensor unit done
This is how the final result looks like for me:
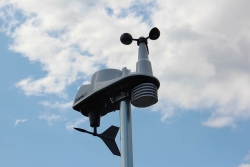
Idea during installation is to make sure the sensor unit has the solar cell directed to south (180°) allowing it to capture maximum sunlight on Northen Hemisphere. This also serves the base of direction for the wind vane. Obviously, you can adjust the deviation from the console if needed. People living in Southern Hemisphere definitely need to do that. Also, you may have something special in your install, the option is there. Remember, this is a serious piece of scientific measurement hardware.
Indoors unit
A running console looks like this:
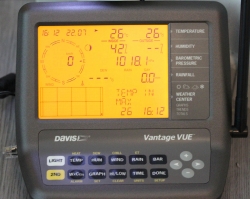
In the screen, the top half is always constant. The buttons "temp", "hum", "wind", "rain" and "bar" can be used to set the bottom half of the screen to display temperature, humidity, wind, rain or barometric pressure details.
As you can see, I took the picture on 22nd July (2019) at 16:12 (pm). It was a warm summer day +26° C both indoors and outdoors. Day was calm and there was no wind. The moon on 22nd July was a waxing cresent. Given my brand new installation, there were not yet measurements for outdoors humidity. The lack of humidity also results in lack of dew point.
People writing the console software have a sense of humor:
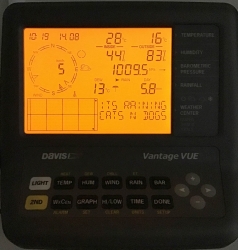
Console display indicates rain (an umbrella) and a text "Its raining cats'n'dogs". Hilarious!
As you can see, the indoors temperature is rather high, +28° C. In reality, that didn't reflect the truth. Later I realized, that keeping the light on will heat the console indoors sensor throwing it off by many degrees. Now I tend to keep the light off and press the "light"-button only when it is dark.
Powering indoor unit
Most people would get the required three C-cell batteries, whip them in and forget about it... until the batteries run out and need to be replaced.
Davis planned an option for that. What you can do is to ignore the battery change and plug the accompanying 5VDC 1A transformer into a wall socket and never need to change the batteries. I love quality hardware, you have options to choose from.
Datalogging
The primary purpose of me owning and running a weather station is to extract the measurements to a Linux PC. An el-cheapo weather stations offer no such option for computer connectivity. Mid-range units have a simple USB-connector (limited to max. cable lenght of 5 meters), some even RS-232 connectivity (max. cable lenght up to 100 meters). When going to these heavy-hitter -models from Davis Instruments, out-of-the-box there is nothing.
To be absolutely clear: Davis Vantage Vue can be attached to a computer, but it is an extra option that is not included in the box.
Here is a picture of USB datalogger expansion unit for Vantage Vue:

Optimal installation in my house requires the console in a place where it's easily visible and accessible. But its nowhere near a computer, so RS232 is the way I go.
I'll cover the details of datalogger expansion, cabling and Linux setup in the next post.
