SSD Trouble - Replacement of a tired unit
Sunday, August 31. 2025
Trouble
Operating multiple physical computers is a chore. Things do happen, especially at times when you don't expect any trouble. On a random Saturday morning, an email sent by a system daemon during early hours would look something like this:
The following warning/error was logged by the smartd daemon:

Device: /dev/sda [SAT], FAILED SMART self-check. BACK UP DATA NOW!

Device info:
SAMSUNG MZ7PC128HAFU-000L1, S/N:S0U8NSAC900712, FW:CXM06L1Q, 128 GB

For details see host's SYSLOG.
Aow crap! I'm about to lose data unless rapid action is taken.
Details of the trouble
Details from journalctl -u smartd:
Aug 30 00:27:40 smartd[1258]: Device: /dev/sda [SAT], FAILED SMART self-check. BACK UP DATA NOW!
Aug 30 00:27:40 smartd[1258]: Sending warning via /usr/libexec/smartmontools/smartdnotify to root ...
Aug 30 00:27:40 smartd[1258]: Warning via /usr/libexec/smartmontools/smartdnotify to root: successful
Then it hit me: My M.2 SSD is a WD. What is this Samsung I'm getting alerted about? Its this one:
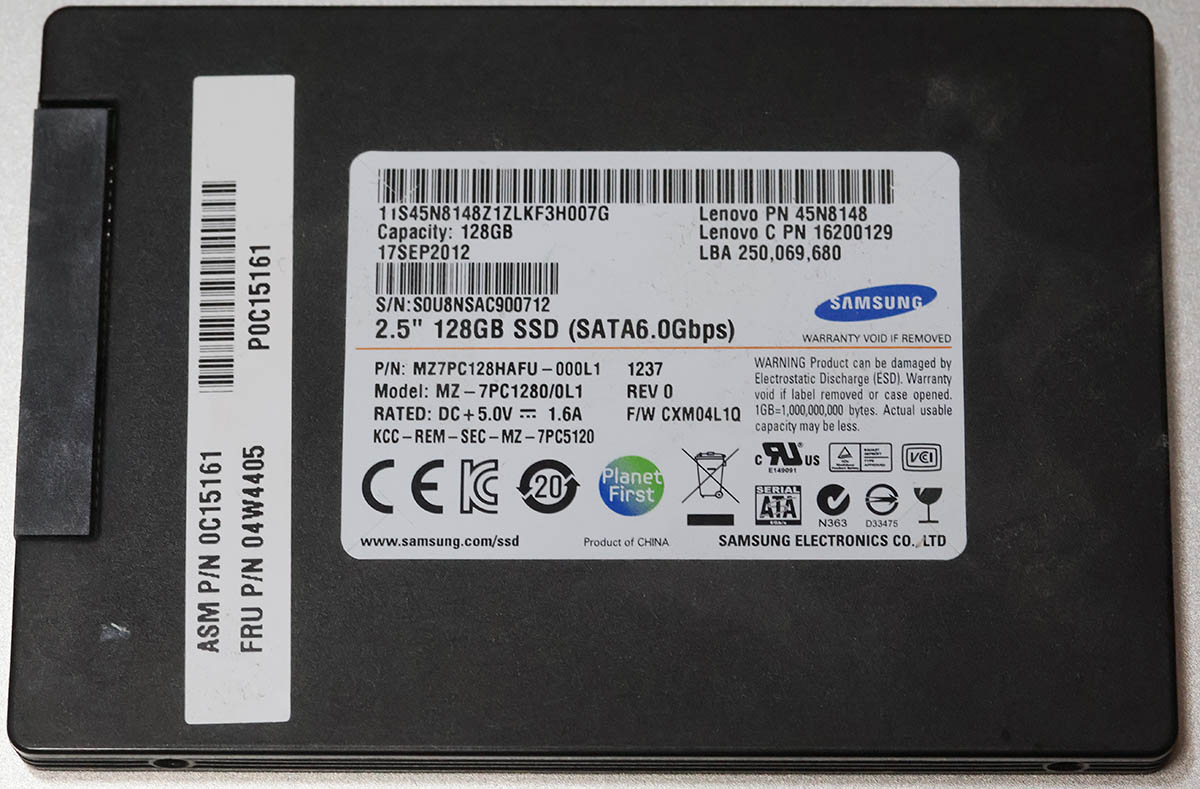
Oh. THAT one! It's just a 2.5" S-ATA SSD used for testing stuff. I think I have a Windows VM running on it. If you look closely, there is word "FRU P/N" written in block letters. Also under the barcode there is "Lenovo PN" and "Lenovo C PN". Right, this unit manufactured in September 2012 was liberated from a Laptop needing more capacity. Then it ran one Linux box for a while and after I upgraded that box, drive ended up gathering dust to one of my shelves. Then I popped it back into another server and used it for testing.
It all starts coming back to me.
More details with parted /dev/sda print:
Model: ATA SAMSUNG MZ7PC128 (scsi)
Disk /dev/sda: 128GB
Sector size (logical/physical): 512B/512B
Partition Table: gpt
Disk Flags:

Number  Start   End    Size    File system  Name                          Flags
 1      1049kB  106MB  105MB   fat32        EFI system partition          boot, esp, no_automount
 2      106MB   123MB  16.8MB               Microsoft reserved partition  msftres, no_automount
 3      123MB   127GB  127GB   ntfs         Basic data partition          msftdata, no_automount
 4      127GB   128GB  633MB   ntfs                                       hidden, diag, no_automount
Oh yes, Definitely a Windows-drive. Further troubleshooting with smartctl /dev/sda -x:
Vendor Specific SMART Attributes with Thresholds:
ID# ATTRIBUTE_NAME          FLAGS    VALUE WORST THRESH FAIL RAW_VALUE
  9 Power_On_Hours          -O--CK   090   090   000    -    47985
 12 Power_Cycle_Count       -O--CK   095   095   000    -    4057
177 Wear_Leveling_Count     PO--C-   017   017   017    NOW  2998
178 Used_Rsvd_Blk_Cnt_Chip  PO--C-   093   093   010    -    126
179 Used_Rsvd_Blk_Cnt_Tot   PO--C-   094   094   010    -    244
180 Unused_Rsvd_Blk_Cnt_Tot PO--C-   094   094   010    -    3788
190 Airflow_Temperature_Cel -O--CK   073   039   000    -    27
195 Hardware_ECC_Recovered  -O-RC-   200   200   000    -    0
198 Offline_Uncorrectable   ----CK   100   100   000    -    0
199 UDMA_CRC_Error_Count    -OSRCK   253   253   000    -    0
233 Media_Wearout_Indicator -O-RCK   198   198   000    -    195
Just to keep this blog post brief, above is a shortened list of the good bits. Running the command spits out ~150 lines of information on the drive. Walking through what we see:
- Power on hours: ~48.000 is roughly 5,5 years.
- Since the unit manufacture of Sep -12 it has been powered on for over 40% of the time.
- Thank you for your service!
- Power cycle count: ~4000, well ... that's a few
- Wear level: ~3000. Or when processed 17. I have no idea what the unit of this would be or the meaning of this reading.
- Reserve blocks: 126 reserve used, still 3788 unused.
- That's good. Drive's internal diagnostics has found unreliable storage and moved my precious data out of it into reserve area.
- There is still plenty of reserve remaining.
- The worrying bit is obvious: bad blocks do exist in the drive.
- ECC & CRC errors: 0. Reading and writing still works, no hiccups there.
- Media wear: 195. Again, no idea of the unit nor meaning. Maybe a downwards counter?
Replacement
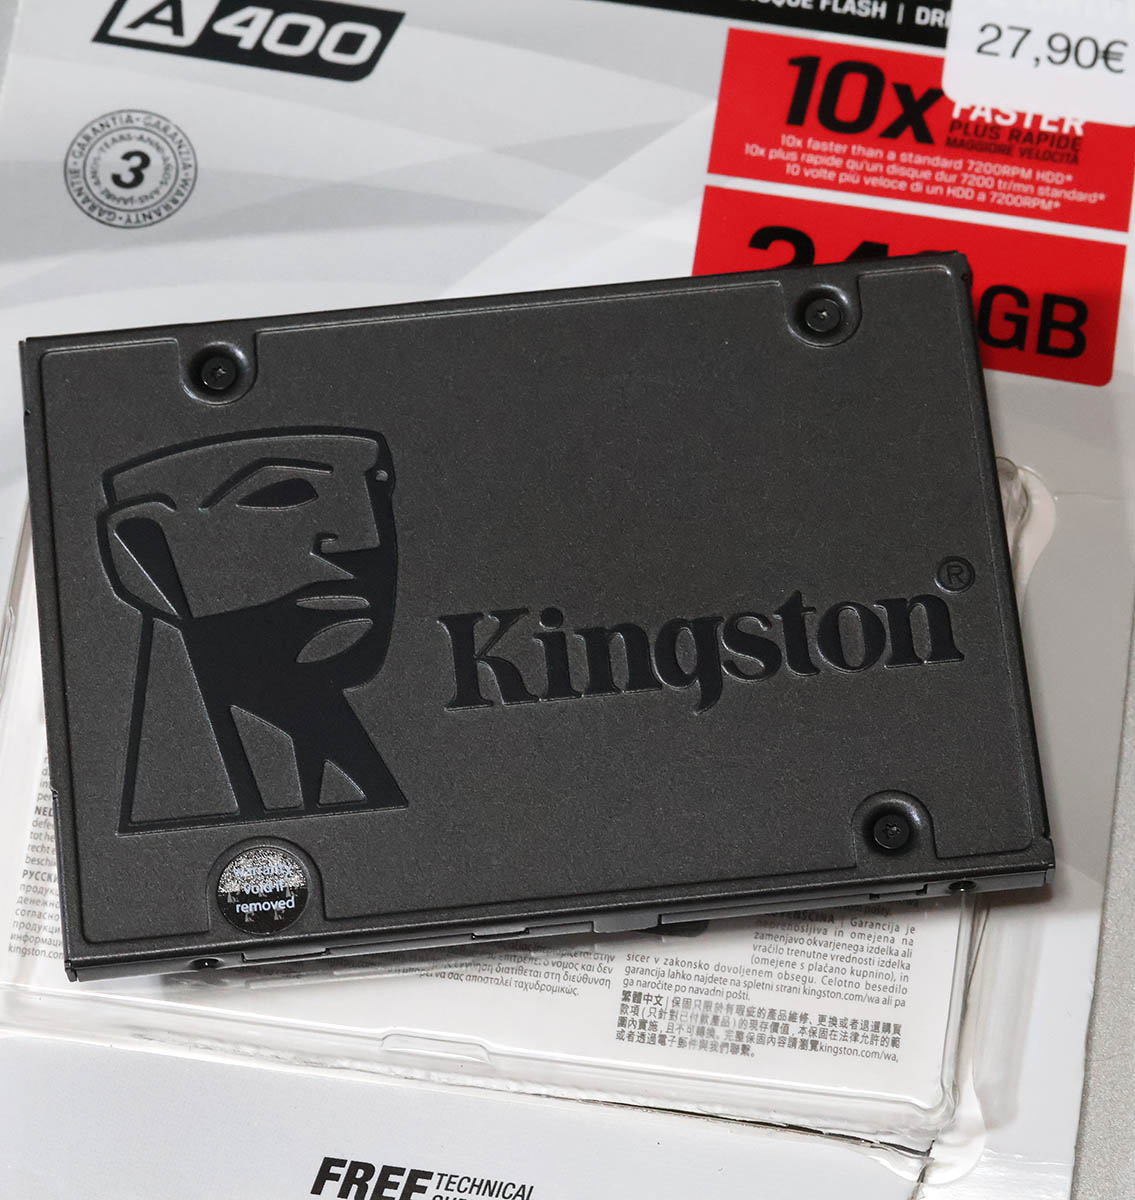
Yeah. Let's state the obvious. Going for the cheapest available unit is perfectly ok in this scenario. The data I'm about to lose won't be the most precious one. However, every single time I lose data, that's a tiny chunk stripped directly from my soul. I don't want any of that to happen.
Data Recovery
A simple transfer time dd if=/dev/sda of=/dev/sdd:
250069680+0 records in
250069680+0 records out
128035676160 bytes (128 GB, 119 GiB) copied, 4586.76 s, 27.9 MB/s

real    76m26.771s
user    4m30.605s
sys     14m49.729s
Hour and 16 minutes later my Windows-image was on a new drive. I/O-speed of 30 MB/second isn't much. With M.2 I'm used to a whole different readings. Do note, the replacement drive has twice the capacity. As it stands, 120 GB is plenty for the use-ase.
Going Mechanical
Some assembly with Fractal case:
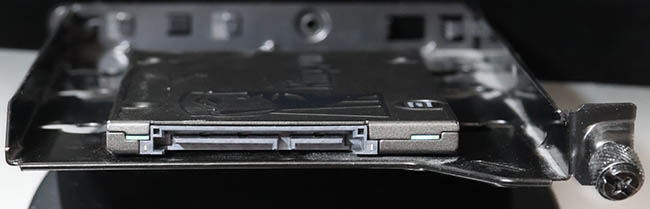
Four phillips screws to the bottom of the drive. Plugging cables back. That's a solid 10 minute job. Closing the side cover of the case and booting the server to validate everything still working as expected.
New SMART
Doing a 2nd round of smartctl /dev/sda -x on the new drive:
Vendor Specific SMART Attributes with Thresholds:
ID# ATTRIBUTE_NAME          FLAGS    VALUE WORST THRESH FAIL RAW_VALUE
  1 Raw_Read_Error_Rate     -O--CK   100   100   000    -    0
  9 Power_On_Hours          -O--CK   100   100   000    -    1
 12 Power_Cycle_Count       -O--CK   100   100   000    -    4
148 Unknown_Attribute       ------   100   100   000    -    0
149 Unknown_Attribute       ------   100   100   000    -    0
167 Write_Protect_Mode      ------   100   100   000    -    0
168 SATA_Phy_Error_Count    -O--C-   100   100   000    -    0
169 Bad_Block_Rate          ------   100   100   000    -    54
170 Bad_Blk_Ct_Lat/Erl      ------   100   100   010    -    0/47
172 Erase_Fail_Count        -O--CK   100   100   000    -    0
173 MaxAvgErase_Ct          ------   100   100   000    -    2 (Average 1)
181 Program_Fail_Count      -O--CK   100   100   000    -    0
182 Erase_Fail_Count        ------   100   100   000    -    0
187 Reported_Uncorrect      -O--CK   100   100   000    -    0
192 Unsafe_Shutdown_Count   -O--C-   100   100   000    -    3
194 Temperature_Celsius     -O---K   026   035   000    -    26 (Min/Max 23/35)
196 Reallocated_Event_Count -O--CK   100   100   000    -    0
199 SATA_CRC_Error_Count    -O--CK   100   100   000    -    131093
218 CRC_Error_Count         -O--CK   100   100   000    -    0
231 SSD_Life_Left           ------   099   099   000    -    99
233 Flash_Writes_GiB        -O--CK   100   100   000    -    173
241 Lifetime_Writes_GiB     -O--CK   100   100   000    -    119
242 Lifetime_Reads_GiB      -O--CK   100   100   000    -    1
244 Average_Erase_Count     ------   100   100   000    -    1
245 Max_Erase_Count         ------   100   100   000    -    2
246 Total_Erase_Count       ------   100   100   000    -    10512
                            ||||||_ K auto-keep
                            |||||__ C event count
                            ||||___ R error rate
                            |||____ S speed/performance
                            ||_____ O updated online
                            |______ P prefailure warning
Whoa! That's the fourth power on to a drive unboxed from a retail packaking. Three of them had to be in the manufacturing plant. Power on hours reads 1, that's not much. SSD life left 99 (I'm guessing %).
Finally
All's well. No data lost. Just my stress level jumping up.
My thinking is: If that new drive survives next 3 years running a Windows on top of a Linux, then it has served its purpose.
On Profitability of Solar Panel Installation
Sunday, August 17. 2025
Solar panel, photovoltaic system, solar generator. These babies have many names.
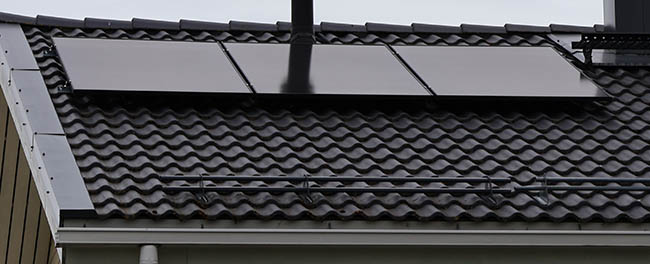
There are three of 505 watt panels on my roof. Besides the ones in the picture, I do have more panels. This is just my 1500W on sunrise side. Having micro-inverters works well for east-west -installations.
Conversation around solar panels is constantly bubbling. Lot of discussion, not so much facts. Plenty of opinions back and forth. Topics being reviewed include:
- "Installation is expensive. Is this profitable?"
- "Installation is expensive. What's the breakeven in years?"
- "Sun doesn't shine in Finland! Will this make any sense?"
All of those are valid questions. As I was tempted to find out, I went and ordered an installation last year. In this blog post summarize my experience with solar power since last summer.
Summary
Here's the thing briefly with spoilers:
- No, the thing isn't profitable. It doesn't make any sense as breakeven in cost savings to cover the installation fees is many many many years.
- When it goes to electricity, I wanted some security of supply by having those panels on my roof. That went completely sideways! Those things won't do anything, unless there is a functioning electicity network.
- This is because inverter needs a place to feed excess electricity into.
- If no such sink exists, inverter chooses to go silent.
- This behavior can be altered by going for a more expensive offgrid installation. I do not have such thing.
- Sun does shine in Finland. Savings in electricity is real and tangible.
Measuring stuff
Last summer I wrote a piece about HAN/P1 -port. This is the basis. It is imperative to get exact readings on electricity consumption and readings on exported excess energy. This is available at electricity meter. Second thing to measure is the solar production, for this I have a TCP-based M-bus solution from solar panel controller hub.
I'm skipping a ton of details, this is what a Grafana-visualization would look like:
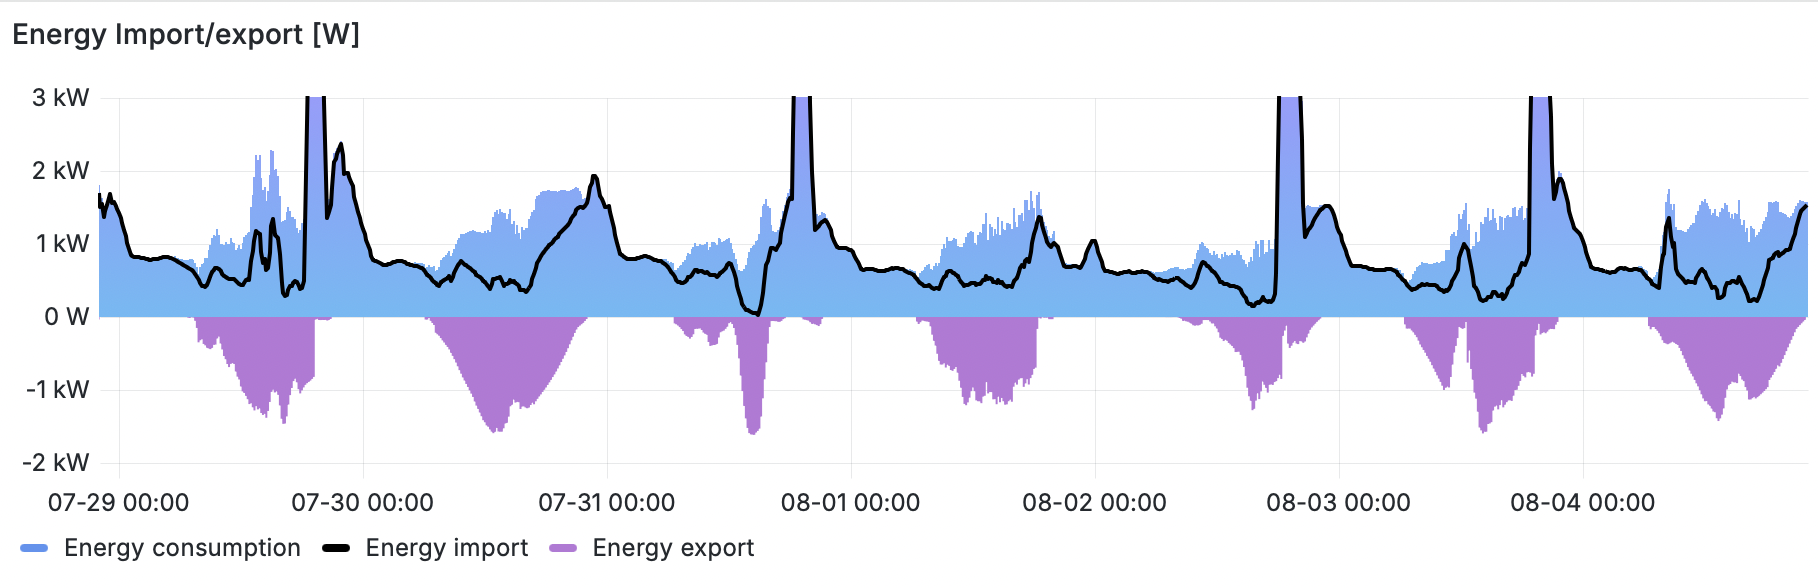
Key:
- Blue area: total electricity consumption of my house
- Black line: amount of imported electricity
- Purple area: amount of exported electricity
Findings:
- When there is solar production indicated by purple excess export, black line for imported energy drops nicely below total consumption.
- Panels do reduce my electricity bill by providing some of my consumption from own production.
- There are cases where import actually reaches zero. Momentarily, I'm not paying anything for my electricity. Nice!
- There are many cases where black line for import isn't at zero while there is plenty of export.
- This is the design flaw with solar panel installation.
- The only real way of keeping all the solar harvest is to have a battery where export would go to at all times.
- Also, this is how electricity works. Panel must have a destination where harvested energy goes into each millisecond. If there isn't one, it goes to export.
Results of Measurement
For a period of 10 months, staring from 3rd August 2023 to 29th May 2024 is a reference. No own electricity production. From 29th May 2024 to 3rd August 2025 is the "new normal", panel assisted consumption. As a weekly average, a year with and without solar panels look like this:
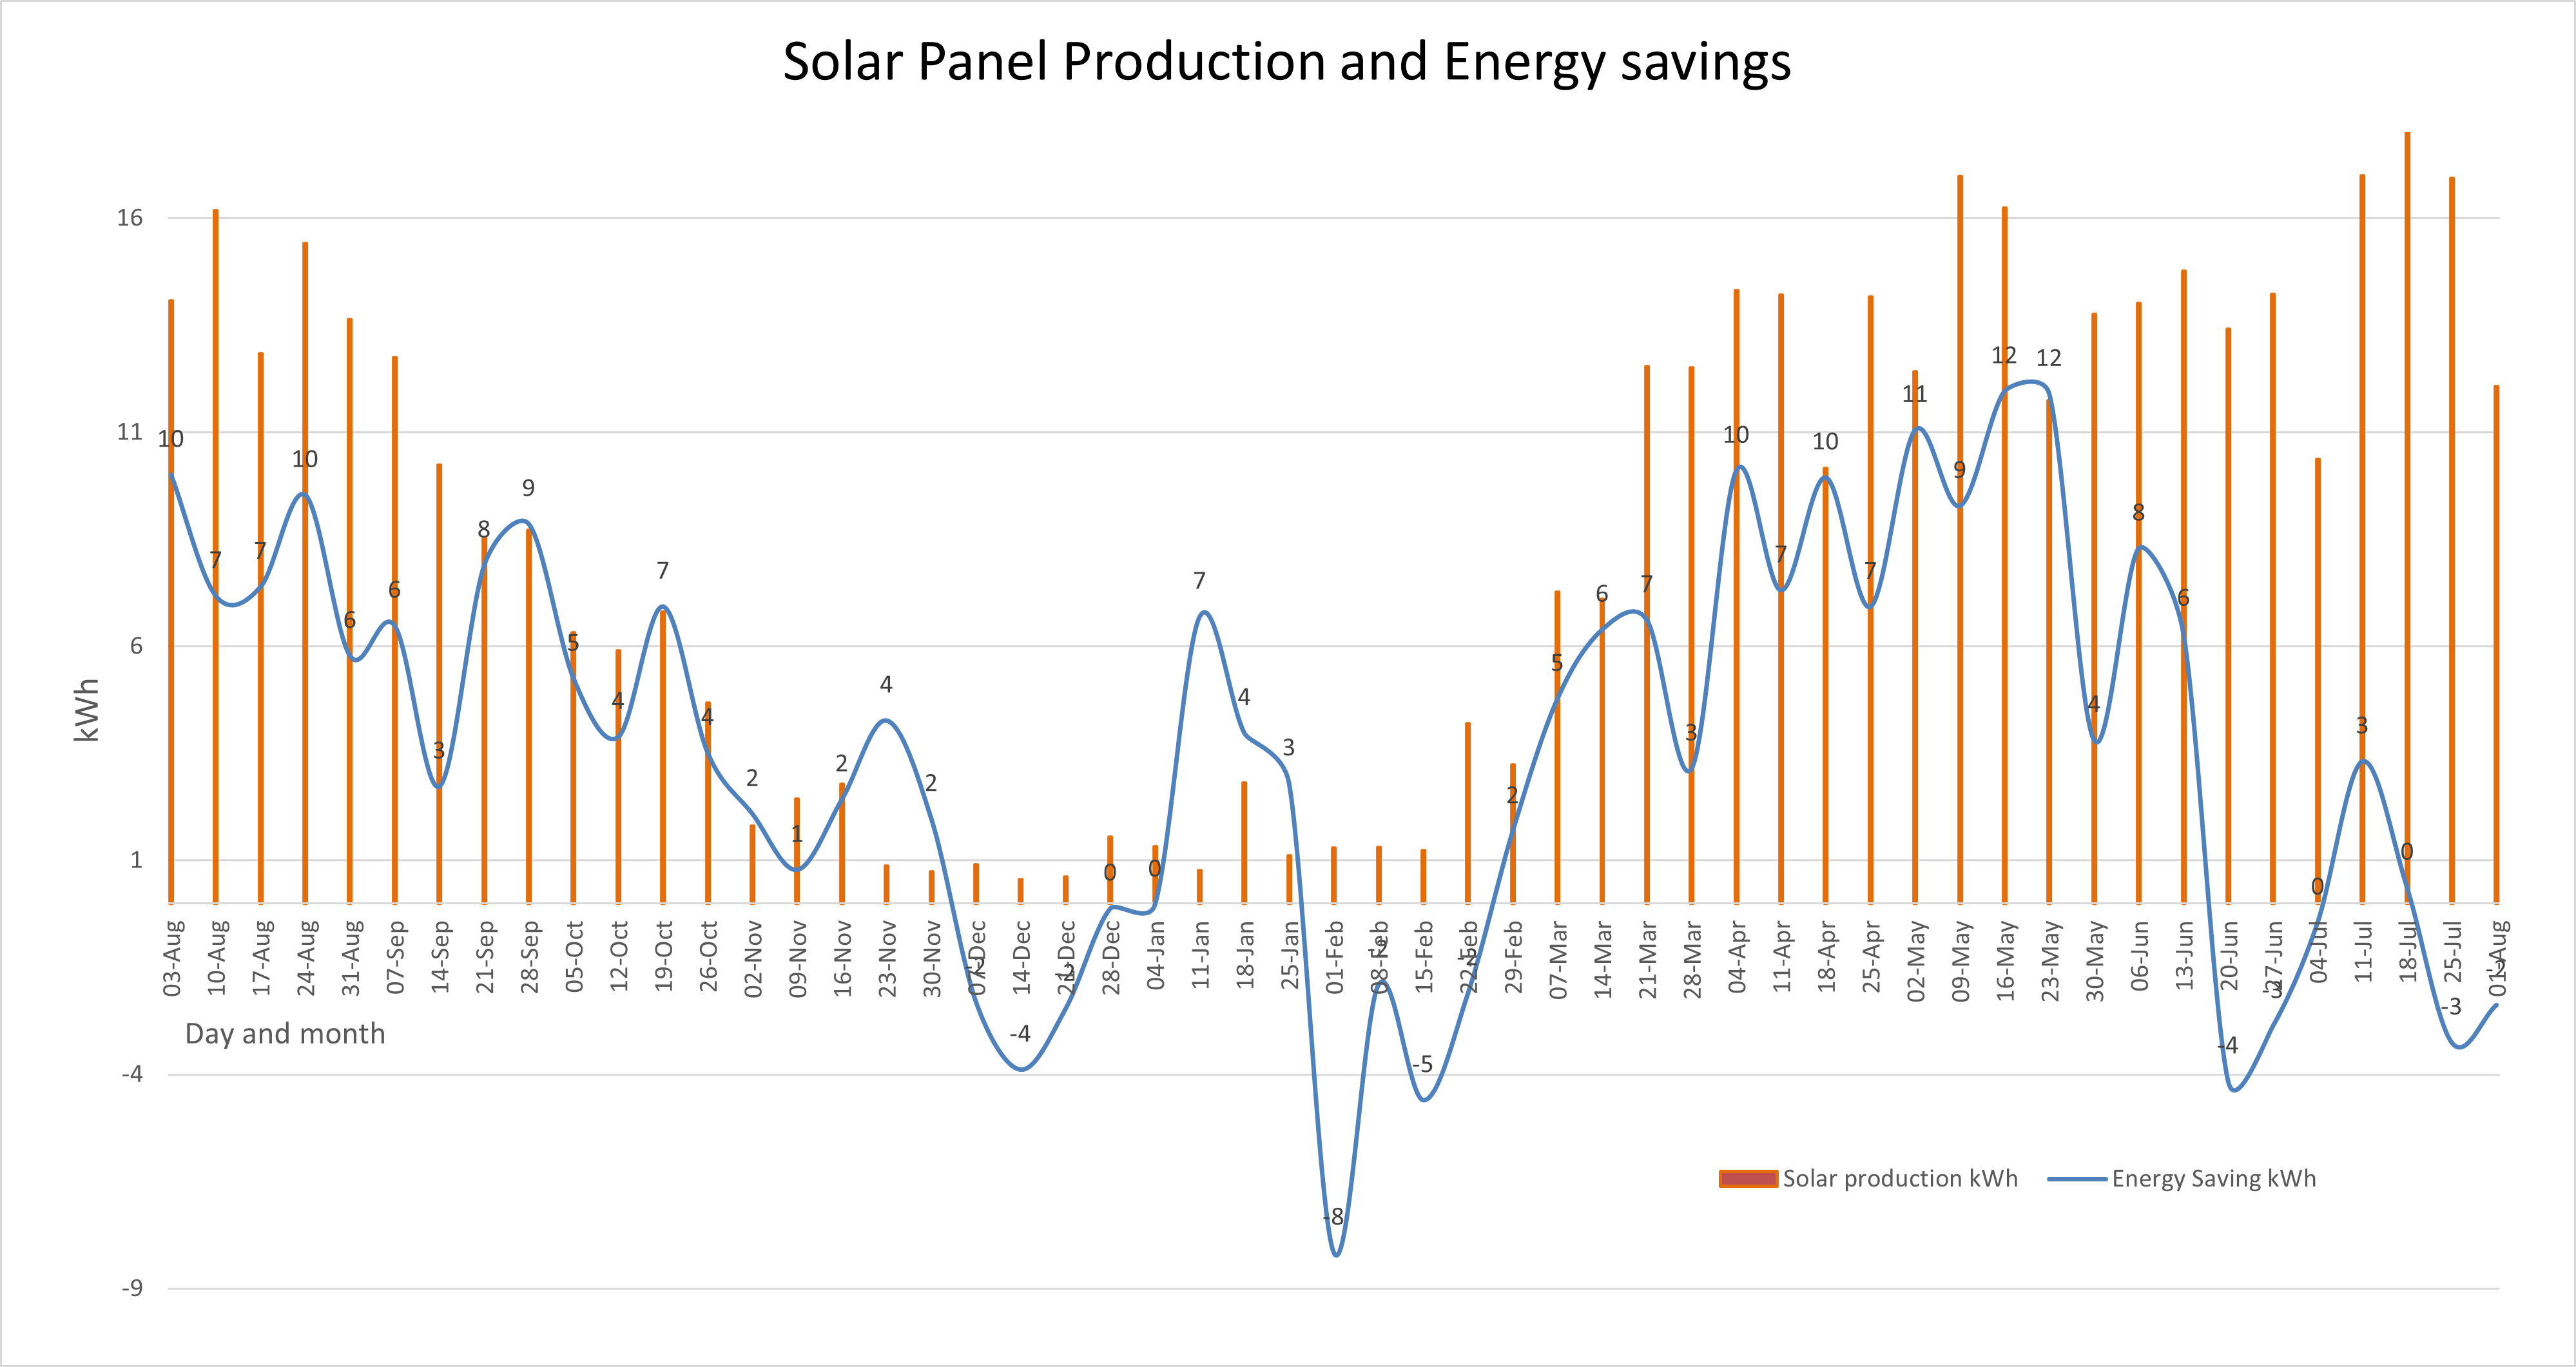
Key:
- Orange bars indicate weekly average of produced energy.
- Blue line indicates difference between year without panels and year with panels. There are occasions where saving exceeds produced amount.
- Years are not comparable. Weather tends to do whatever it likes.
Findings:
- It would have been really nice to have a "clean" reference data for entire 12 month period. Unfortunately, this wasn't possible. Still, 10 months of a year is still a good reference material to measure improvement. The improvement is there.
- There is miniscule amount of solar production in November, December and January.
- Indeed. Sun does shine occasionally during nothern hemisphere dark months.
- Energy savings are real
- On the right hand side of the graph, months June and July indicate no energy saving as both years have solar panels. This is the flaw in refenrence consumption data.
The Important Stuff
Lots of graphs and details. What's the key takeaway here? Can we summarize all this somehow?
What Others Say on Profitability
There is a Master's Thesis from Feb 2024: Techno-economic analysis on optimizing the value of photovoltaic electricity in a high-latitude location.
Gist of the thesis is twofold: First, to maximize the profitability, consume your own production. Second, (this is self-evident) installation direction is a factor. In plain words, eat your own dog food and on northern hemisphere, install your panels to southernly direction. The design of PV system installation must be to capture as much sun as possible and consume your own production as much as possible.
Measuring Self-consumption
My Home Assistant setup comes with Energy-dashboard as default:
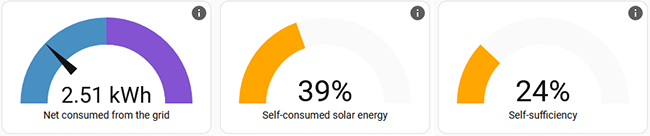
It has a reading for "self-consumed solar energy". Exactly what I should be monitoring!
As this is important, there is a discussion on calculation "Computation of self-sufficiency/autarkie and self-usage of PV". From the discussion thread following useful math can be found:
energy_used = energy_imported + energy_production - energy_exportednet_returned_to_grid = energy_exported - energy_importedself_sufficiency_perc = (energy_used - energy_imported ) / energy_used * 100.0self_consumed_solar_energy_perc = (energy_production - energy_exported ) / energy_production * 100.0
Doing the same with Home Assistant is rather simple. Btw. I'm using VictoriaMetrics add-on. Doing something like this in MetricsQL shows following data for the past year:
delta(sensor.active_energy_import[1y]) = 9000 kWhdelta(sensor.active_energy_export[1y]) = 1700 kWhdelta(sensor.total_production[1y]) = 3400 kWh
This is exactly what I'll need to get: self_consumed_solar_energy_perc = 49%
I can self-consume roughly half of my production and rest is exported as excess.
This is a vital metric, as indicated by the thesis on profitability. To increase this percentage, I'd need to store the production in a battery. This battery might be in a car. Little bit of Home Assistant -tinkering and I'd be able to charge the car on excess export energy. Alternative is to double my investment and go for a (expensive) solar battery storage. On those two, I'd might choose the EV.
Measuring Profitability
All the relevant numbers are there, let's convert all this into time and money. More math:
energy_saved = energy_production - energy_exportedenergy_saved = 3400 - 1700 = 1700 kWh
That is the amount I used of my own production, but didn't have to pay for import. My local network provider takes 4 cents / kWh for transfer. Assuming my energy costs 7 cents / kWh for the entire period, then 1700 kWh would have cost me 190€.
Assuming I'd have a good year and save 200€ on my electricity bill. Further, assuming my PV system cost after tax deductions would be 5000€. A simple 5000/200 division gives the breakeven. That's 25 years! No way, this is profitable nor sensible. Well, at least I have security of supply, when there is an outage .... oh, wait! As mentioned earlier, the panels turn off when there is no electricity. A complete bust!
Finally
On financial perspective, this is not sane. Without batteries, I simply cannot reach the self-consumption numbers needed.
Tinkering with these is a fun hobby, but that's as far it goes.
Windows 10 users getting pressure to upgrade
Saturday, August 16. 2025
This is what's happening in my system tray:
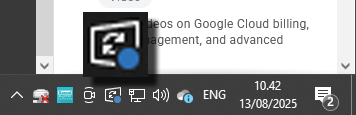
Blue is an optional update indicator. Yellow or orange indicate security patches.
This is what happens when I click the update icon:
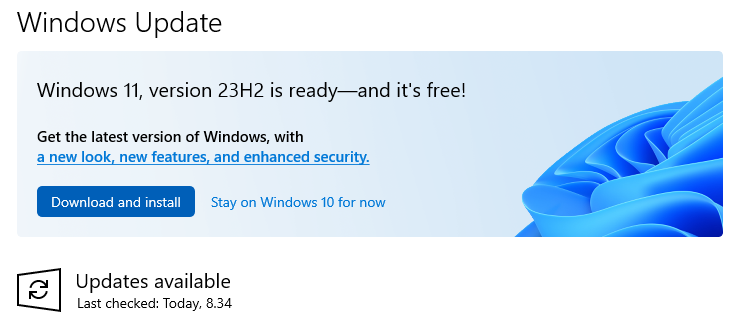
Pretty good advertisement space! Also, additional updates include:
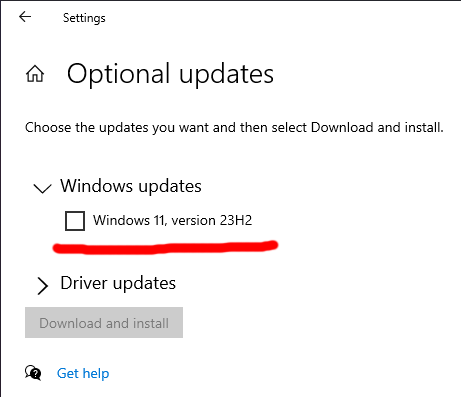
I have zero intention to upgrade. If Windows 11 had anything better or something I'd ever need, I'd already be running the darned thing. As it's just a Windows 10 with pretty bad user interface, I'll stick with my 10 for time being.
Thanks, Microsoft!

