New Weather Station - Davis Vantage Vue - Part 2 of 2: Linux installation
Tuesday, November 5. 2019
This is a part two out of two on my Davis Vantage Vue weather station installation story. Previous part was about hardware installation.
Datalogger expansion
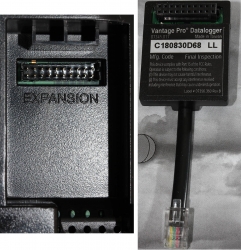
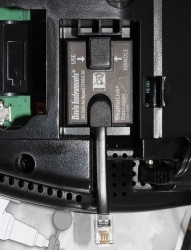
The indoors console has a slot for expansion devices. I went for the RS-232 WeatherLink datalogger expansion:


RS232 Cabling
The datalogger has a very short cable and a RJ-11 connector on the other end. The obvious good thing is the common availability of telephone extension cords to get past the 5 cm cable lenght of the datalogger. A regular landline telephone typically has such RJ-11 connectors in it and what I did was to get an inexpensive extension cord with suitable lenght.
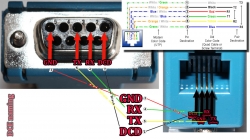
For computer connectivity, with datalogger box has a blue RJ-11 to RS232 converter. The four connected pins of the converter are as follows:

RS232 and Linux
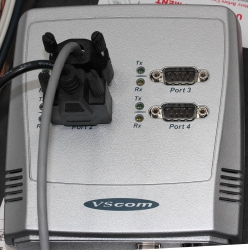
Most computers today don't have a RS232-port in them. To overcome this, years ago I bought a quad-RS232-port USB-thingie:

If you look closely, Port 1 of the unit has a DIY RS232-connector attached into it. That's my Vantage Vue cable connected to the indoors console. Also, note the lack of the blue RJ-11 to RS232 converter unit. I reverse engineered the pins and soldered my cable directly to a D-9 connector to get the same result.
Now the hardware parts is done. All the connectors are connected and attached to a PC.
Software
Half of the work is done. Next some software is needed to access the data in the data logger.
For Windows and macOS
Those not running Linux, there is WeatherLink software freely available at https://www.davisinstruments.com/product/weatherlink-computer-software/. It goes without saying, the software is useless without appropriate hardware it gets the inputs from. I never even installed the software, as using a non-Linux was never an option for me. So, I have no idea if the software is good or not.
For Linux
As you might expect, when going to Linux, there are no commercial software options available. However, number of open-source ones are. My personal choice is WeeWX, its available at http://www.weewx.com/ and source code at https://github.com/weewx/weewx.
Install WeeWX:
- Download software:
git clone https://github.com/weewx/weewx.git - In git-directory, create RPM-package:
make -f makefile rpm-package SIGN=0 - As root, install the newly created RPM-package:
rpm --install -h dist/weewx-3.9.2-1.rhel.noarch.rpm - That's it!
Configure WeeWX:
- (dependency) Python 2 is a requirement. Given Python version 2 deprecation (see https://pythonclock.org/ for details), at the time of writing, there is less than two months left of Python 2 lifetime, this project really should get an upgrade to 3. No such joy yet.
- (dependency) pyserial-package:
pip install pyserial - Run autoconfig:
wee_config --install --dist-config /etc/weewx/weewx.conf.dist --output /etc/weewx/weewx.conf- In the array of questions, when being asked to choose a driver, go for
Vantage (weewx.drivers.vantage)
- In the array of questions, when being asked to choose a driver, go for
- Inspect the resulting
/etc/weewx/weewx.confand edit if necessary:- Section
[Station]week_start = 0
- Section [StdReport]
HTML_ROOT = /var/www/html/weewx
- (optional for Weather Underground users), Section
[StdRESTful]- Subsection
[[Wunderground]] - Enter station name and password
enable = true
- Subsection
- Section
- Configuring done!
Now you're ready (as root) to start the thing with a systemctl start weewx.
On a working system, you should get LOOP-records out of weewxd instantly. After a little while of gathering data, you should start having set of HTML/CSS/PNG-files in /var/www/html/weewx. It's a good idea to set up a web server to publish those files for your own enjoyment. This is something you don't have to do, but I strongly advice to enable HTTP-endpoint to your results. I will immensly help determining if your system works or not.
One reason I love having a weather station around is to publish my data to The Net. I've been tagging along with Weather Underground for years. There has been good years and really bad years, when Wunderground's servers have been misbehaving a lot. Now that IBM owns the thing, there has been some improvements. The most important thing is there is somebody actually maintaining the system and making it run. Obviously, there has been some improvements in the service too.
Aggregation problem
When I got my system stable and running, I realized my wind data is flatline. In nature it is almost impossible for not to be windy for multiple days. I visually inspected the wind speed and direction gauges, they were working unobstructed. However, my console did not indicate any wind at all.
After multiple days of running, I was about to give up and RMA the thing back to Davis for replacement, the console started working! That was totally unexpected. Why: 1) the system did not work, 2) the system started working without any actions from me. That was the case for me. As the problem has not occurred since, it must have been some kind of newness.
What next
Now that everything is up, running and stays that way. There's always something to improve. What I'm planning is to do is pump the LOOP-records to Google BigQuery.
As a side note: when new information is available, it will be emitted by weewxd as LOOP: <the data here> into your system logs. However, that data isn't used. After a period of time, your Vantage Vue will aggregate all those records into a time-slot record. That will be used as your measurement. Since those LOOP-records are simply discarded I thought it might be a good idea to base some analytics on those. I happen to know Google BigQuery well from past projects, all that I need is to write a suitable subsystem into weewx to pump the data into a correct place. Then it would be possible to do some analytics of my own on those records.

